How Value Investing Stock Screeners Sabotage Your Portfolio
For some reason a lot of value investors want to rely almost totally on stock screeners when value investing.
The idea is that since most mechanical value investing strategies are based entirely on financial statement data, and since stock screeners do the work of taking those statements and calculating the desired ratios, mechanical value investing should be possible if you just pick stocks off of a suitable screener.
I can see the allure of using a stock screener as your first and only mode of value investing research. Stock screeners do the work for you -- they are based on financial statement data which is then crunched into metrics investors intend to invest by. Results are spit out onto a page and neatly ranked from those stocks that most qualify to those which just barely meet the chosen standard. Mechanical value investing is supposed to take the thinking and emotion, and in turn human error, out of value investing, so freedom from digging down into the financial statements helps achieve this. Ultimately, some people think that screeners make value investing easy.
While I have always dug down into a company's annual and quarterly reports before investing, I've been tempted to skip this step in favour of relying completely on screeners to run a mechanical value investing strategy, as well. I resisted, knowing that screeners have some big drawbacks. It wasn't until I started putting this site together that I realized just how problematic relying on stock screeners can be.
To start off, it's worthwhile pointing out an obvious fact about stock screeners.
The data value investing screeners are based on is scrubbed.
I'm sure that most investors out there realize that the data screeners use is scrubbed but it's worth pointing out for people new to mechanical value investing.

Scrubbing basically means forcing the data found on financial statements into a specific standard for presentation. Of course, the screen provider doesn’t scrub the data for you so that everything works well with the screen they offer – the data the screen provider uses is purchased from a 3rd party who has their own standards for presentation.

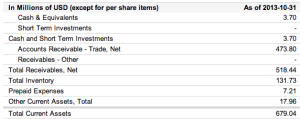
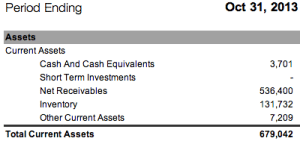
Sometimes this presentation can contain material changes in the accounts shown and figures displayed. By scrubbing the data, the data aggregation company can take accounts from the original statements and mash them together to ensure uniform presentation from one company to another. While not always a problem, as with the Google Finance and Yahoo! Finance presentation of Conn’s current assets shown here, mashing accounts together can cause problems if you need those separate accounts to calculate your desired ratios.
At the very least, investors should be going to the source -- the original finance statements -- to double check the figures used which lead to being included in the screen results.
The data value investing screeners are based on is often misleading.
Screening stocks based on PE ratios is probably the most problematic way to use a stock screener. Often companies will have a large onetime windfall that boosts earnings per share and may make the firm look cheap on an earnings basis. This is obviously a dangerous situation for people who are intent on just using screeners to pick stocks. The level of earnings that a firm shows in one year may not be reached again for years – if ever.
A second problem comes with off balance sheet items. As the name implies, off balance sheet items are assets or liabilities that aren’t included in the company’s financial statements due to the way that modern accounting works. Being excluded from presentation does not mean that these items are small or insignificant – when factored into the actual figures, these items can completely change the investment merits of a company.
Fill your portfolio full of high potential, low risk, net net stocks. Click Here.
The most common off-balance sheet items I find have to do with pension liabilities or diluted share count. An underfunded pension is a cause for concern because the shortfall has to be made up by the company since that money is supposed to go to workers. In this way, the shortfall is similar to (but not the same as) a debt that has to be repaid.
At other times management will not consider stock options worth including in the diluted share count because the options are not currently in the money. If you’re expecting the share to spike from $6 to $16 within the course of a year and 10 million stock options are coming due at $8 then including those options in the diluted share can be critical to whether value investing works out for you or not.
Value investing screeners often use the latest financials but those may not be timely.
A value investing screener is only as good as the data used. Depending on the screener, the financials used may be anywhere from 3 to 12 months old... or older.
Some companies just haven’t filed a financial report for a while – not all firms with stocks you can buy through your existing stockbroker have to, believe it or not. That can cause problems if you’re investing by the numbers. A lot can happen during the course of a year, which means that financial figures can change dramatically.
When I hand pick investment candidates I always sort through our raw screens and exclude companies with financial statements too old to be reliable. Including these stocks in a portfolio of mechanically picked investments can lead to nasty surprises. Why would you want to base your investment on unreliable data? I wouldn’t, which is why I sort through our screens by hand to narrow down the selection to the most promising firms.
Company specific events can nullify value investing metrics.
Even if the statements used are relatively current, events can take place between quarterly reporting periods which can completely nullify an investment thesis.
Many companies trading below their net current asset value, for example, will decide to liquidate or sell operations, paying out the proceeds as a special dividend. If investors buy after the dividend but base their purchase on the financials that came out in the most recent reporting period then the financial data used could be completely irrelevant.
The same goes for acquisitions. Sometimes a firm trading well below NCAV will spend its cash by purchasing a firm it hopes will spark growth. Usually this means swapping cash assets for fixed or intangible assets, often eliminating the business’s net net stock status in the process.
Use value investing screeners as a first step only.
Value investing screeners are far from useless – it would be incredibly hard to put together a net net stock portfolio without them. Investors just have to see stock screeners for what they are – a good initial tool you can use to research investment candidates when value investing.
That’s exactly what we do at Net Net Hunter. While we have over 400 net net stocks listed on our raw screens, we examine each firm’s situation then drill down into the fundamentals of the most promising candidates to arrive at a shortlist of stocks that meet our own specific style of net net stock investing. These shortlists represent the very best net net stock opportunities available in the markets we cover.
The intelligent investor uses stock screeners as a first step only. He knows the difference between information presented in a standardized form and the small details that need to be examined in order to identify crucial facts about an investment situation. No matter which investment strategy you choose to use, do your homework before you invest.
Great net net stock investment candidates are tough to find. You can solve this problem by signing up for full Net Net Hunter membership. The money you could make off of even just one international net net stock would be enough to pay for full membership access for years.
Not ready for full membership? That’s fine. Just sign up for the free net net stock essential guide in the box below this article. No commitment, no obligation, and we keep your email address 100% confidential. Don’t wait. Sign up now so you can start making over 25% annual returns through net net stocks.


