My NCAV Stocks Returned 38% Per Year -- Here's How
Over the past 4 or 5 years I've been on a quest to dissect Benjamin Graham's famous net net stock value investing strategy to see just how good it is, what makes it work, and how to reap the best possible returns after adopting it.
As the title suggests, this strategy has been rocket fuel for my portfolio. 38% returns are not just good -- they're phenomenally good.
After I show you the charts and data below, I want to qualify a couple things and leave you with the most accurate sense of how my NCAV portfolio and picks performed from the start of 2011 until now, February 16th, 2014.
My Returns -- Position by Position
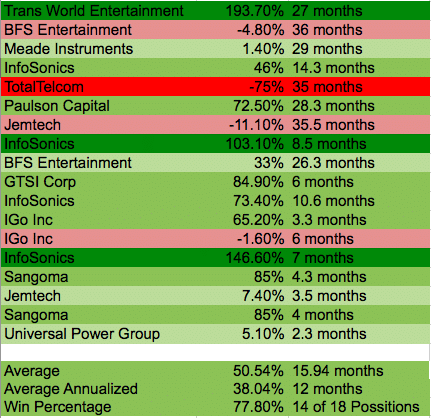
I put together this little chart to give you a really good idea of how these NCAV positions do, and over what time period. This list includes all of my positions -- every single net net stock that I bought during the 3 year stretch. The data on the chart is data I took from my own personal real money portfolio and shows results net of fees:

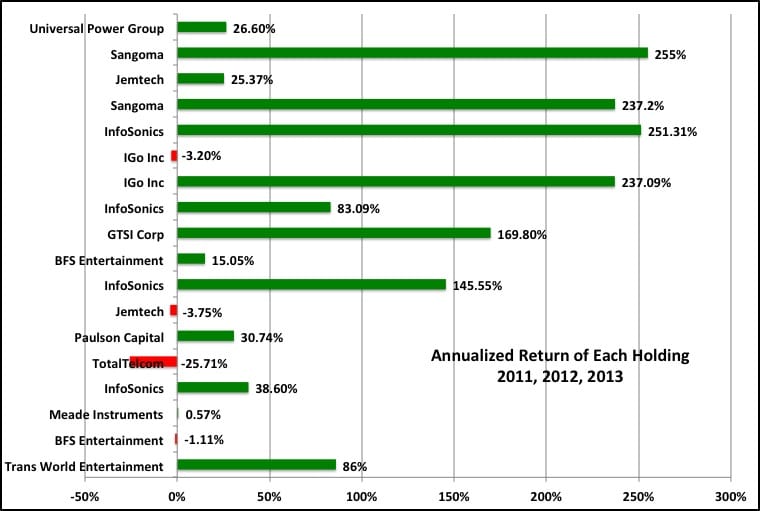
Below, I've annualized the returns to give you an idea of the average annual increase of each NCAV holding over the life of the holding period. Some of these positions were held for under a year, so their annualized returns are higher than their actual returns shown above. In other cases, stocks were held for more than a year so their annualized performance is shown as smaller than their actual realized returns over the holding period.

It's important to remember that NCAV stocks don't go up by a unified amount each year so many of these stocks were a random walk until the price spiked up to the firm's NCAV. The only stock that had a somewhat linear rise to fair value was Trans World Entertainment.
To view my 2014 10 month returns ( stock broker statement), Click Here.
Net Net Stock Returns vs. Real Money Portfolio Returns
Now a bit of qualification...
First of all: The quoted 38% figure is not the returns my portfolio saw over the 3 year stretch -- 38% is the average annualized return of each one of my NCAV stock picks.
My own real money NCAV portfolio has done spectacularly well, also, but not 38% well. Over the same time period, my portfolio has increased by 140%, or just over 100% from January 1st 2011 to December 31st, 2013. That performance is life-changing, but not as good as the 38% per year achieved by my actual picks.
The difference between the results of my net net stocks and my actual portfolio return comes down to:
- transitioning into a NCAV stock saturated portfolio during 2011,
- taking time away from stock picking during 2013 to build this members' site,
- which caused me to hold more cash than I would have liked throughout 2013 and the beginning of 2014.
Barring those qualifications, my NCAV portfolio would have done better and come to approximate the returns of my actual NCAV stocks.
38% Annualized Per Year
Second, these returns are average annualized returns -- not compound returns. They take into account the real dollar returns of my actual real money NCAV portfolio, which includes trading costs. The compound returns would be slightly lower, perhaps 34 or 35% -- but still well above 30% per year.
This is very impressive and lends support to my overall net net stock sub-strategy. Picking the cheapest NCAV stocks, the NCAV stocks with the strongest balance sheets, and the net net stocks that have strong insider activity or a promising story has proven to work very, very well.
These stocks are true money-makers.
I also find it very interesting that my win %, the percentage of NCAV companies that show positive gains, is right in the zone where Warren Buffett forecasted decades earlier. In one of Warren Buffett's partnership letters, Buffett says that these NCAV stocks tend to work out well within 3 years, 70-80% of the time. My own portfolio achieved nearly a 78% win percentage over three years, with TotalTelcom being my only massive loss.
38% Average Annualized Returns in Context
Whenever you look at quoted returns you should always compare the figures against what the market has done in general. I brought up stats from two indexes, the well known S&P 500 and the Russel 2000 small cap index. The S & P 500 provides a familiar benchmark by which to measure results but the Russel 2000 fits better with my actual portfolio for reasons I'll get to below.
S&P 500 (Wikipedia) Total Return Including Dividends:
- 2011 - 2.11%
- 2012 - 16%
- 2013 - 32.39%
Average Annual Gain: 16.83%
Russel 2000 (Google Finance) Index Price Change:
- 2011 - (5.45)%
- 2012 - 12.31%
- 2013- 39.54%
Average Annual Gain: 15.46%
As you can see, the results of the indexes are higher than normal. The typical return to the S&P 500, for example, is usually around 10% per year.
I don't expect the market to keep shooting upwards indefinitely -- at some point it has to stop. At the time or writing this, the S&P 500 is down half a percent and the Russel 2000 is down 1.24% for the first month and a half of 2014. When the market stops performing as well as it has during the last 3 years then I expect the results of my real money NCAV portfolio to come down somewhat -- though the portfolio should still significantly beat the market over the next 3 to 5 year stretch.
Large Classic Benjamin Graham Investors Need Not Apply
How exactly did I achieve these results, and how can you do the same?
I focused on the best possible NCAV investments among the 400 net net stocks available on the site and held a fairly concentrated portfolio. As you saw above, I had a total of 18 NCAV positions over the last 3 years and rarely held more than 8 positions at any one time. Concentrating on a small number of high quality investment opportunities boosted both returns and volatility.
Some investors might not be able to stomach the same amount of volatility I could -- though it's definitely possible for you to develop the emotional temperament that great returns require. I have.
Investing in this concentrated of a portfolio also requires a decent amount of skill and experience in analysis -- something that all investors (myself included) should be striving for throughout their career. Still, it's not necessary to achieve fantastic returns by concentrating. You can do very well by putting together a portfolio of net net stocks that meet basic core requirements. This would mean holding 20+ stocks in your portfolio to realize the statistical returns of net net stocks to a greater degree.
I also focused on small stocks -- tinny stocks in fact. My smallest stock was just over $1 000 000 Canadian dollars, while my largest approached $60 000 000 USD. One of the reasons why this strategy works so well is because most of Wall Street is shut out of the net net stock bonanza. Firms with big portfolios just can't buy these stocks. For that matter, individuals with big portfolios just can't buy these stocks... and the available firms get smaller as the market rises.
And this gets back to the reason why I opted for the Russel 2000 index as a comparison. The Russel 2000 is a small cap index so better reflects the population of net net stocks. NCAV stocks, however, are worlds smaller than the average size stock on the Russel 2000.
Where Do We Go From Here?
Over the next few months I hope to look back at my past picks to understand how they stacked up against my evolving net net stocks strategy. Over the three years I've further refined my understanding of the strategy and what I should be looking for when I pick companies, so I look forward to seeing if some of these past picks would have passed my more rigorous standards today.
If you haven't yet signed up for full Net Net Hunter membership then now is the time to do so. Click here. As you can see, the money that you'll inevitably make off of even just one of these holdings is enough to pay for membership for years -- and right now we have nearly 20 high-potential stocks shortlisted.
If you're not ready for full membership yet then you at least owe it to yourself to request a free net net stock essential guide. Just enter your email address in the box below. No commitment, no obligation, no spam, just our free net net stock essential guide that you can use.


