Global Net Net Stock Screener & Focused Shortlist
How do we determine which net nets end up on our high performance net net stock screener?
And, what is the easiest way for you to get access to net nets that produce the highest average yearly returns?
The High Cost of Not Having a Plan
When I first started investing I used to dig through forum posts and community discussions looking for good investment ideas. Sometimes I'd find someone's entire portfolio, and sometimes that person would sound like an authority on the subject.
But I found out the hard way that sounding like an authority and actually achieving great long term returns are two completely different things. There are a lot of people who sound authoritative but don't actually have a clue how to invest... Unfortunately for those who follow their advice, their portfolio eventually shows it.
My early returns were no different. While it definitely cut down on the amount of work I had to do, my portfolio was a basketcase. From when I first started investing in 2002 until 2012, 10 years later, I was still at the same amount of capital I started with... and it was a rocky period or wins and losses in the meantime.
The cost of not investing properly over that 10 year period was enormous -- I've lost out on well over $750,000 USD in foregone investment profit at this point due to my initial mistake. It really pays to invest properly.
Why Our Net Net Stock Screener Focuses On The Best Net Nets
When you pick stocks for your portfolio, especially when it comes to classic value investing, it's very important to base your picks first and foremost on well-studied quantitative factors. This is the insight that I arrived at at the end of that extremely rocky period. A lot of selection factors have been studied by academics and many of them really boost returns. This empirical approach to stock selection is the backbone of our net net stock screener.
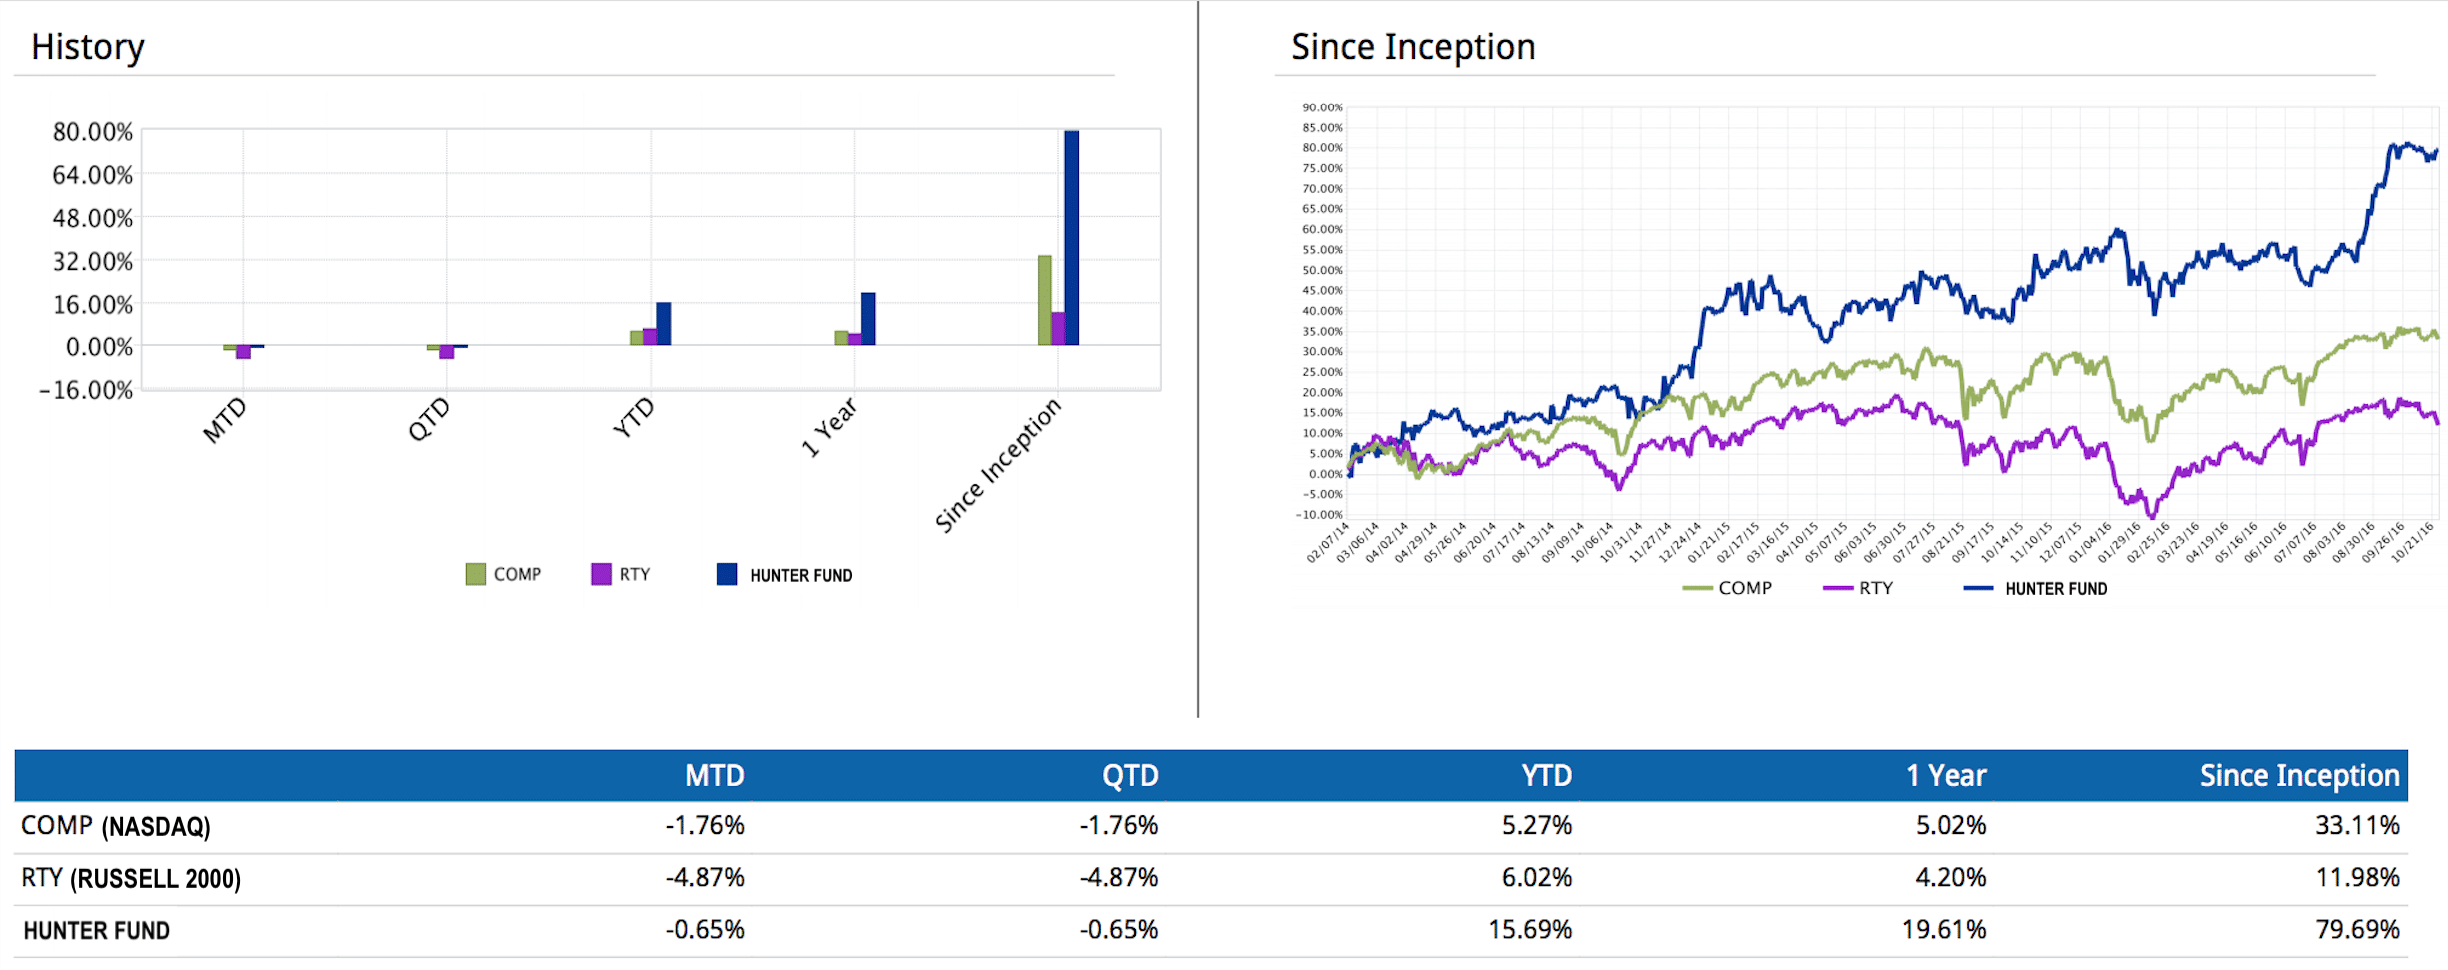
Since making the shift, my portfolio has skyrocketed. My returns have vastly outperformed the overall market and I've done this not just by adopting Graham's famous net net strategy but by focusing on the best possible net net picks. The image above shows my performance since switching to Interactive Brokers, which has a great reporting tool. Unfortunately, my previous broker didn't have a reporting tool...
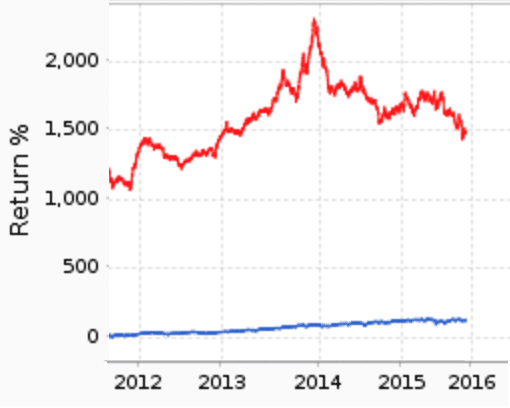
My portfolio has performed exceptionally well. By comparison, American net nets have performed terribly over the last 4 years. I formatted the chart to the left to showcase how badly American net nets have performed since 2012. As you can see, net nets have ended the period exactly where they started in 2012, producing no capital gains whatsoever. If you had invested in just American net nets over the period, and didn't focus on the best net nets, your portfolio would have performed terribly.
But, what if you had of invested in a diversified group of American net nets at the start of 2014? You would have lost roughly 1/3rd of your money while the market grew 33%. Luckily, I've sidestepped this mess by focusing on the best performing net nets using empirically tested criteria, earning ~80% and taking on less risk since February 2014.
Taking a longer look back, it's clear that picking high performance net net stocks provides investors with a massive performance boost. The image below is the same chart shown just above, but extended back to 1999.
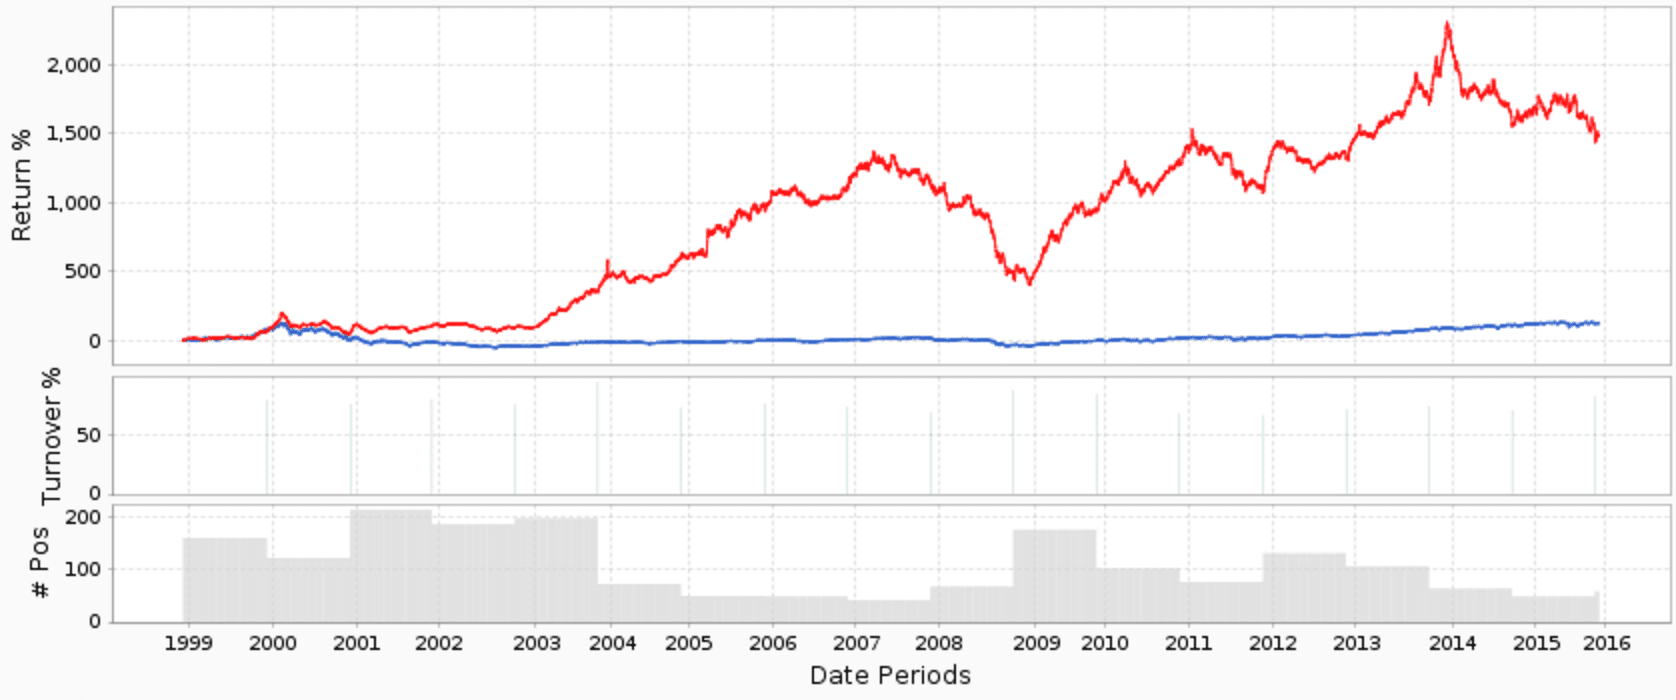
As you can see, American net net stocks trumped the market. Over the 18 year period, a portfolio of randomly selected American net net stocks produced a 1500% return. $10,000 invested in this strategy would have became $150,000. That's fantastic! The same investment in a NASDAQ index fund would have become $22,186. But you could have made a lot more if you controled for just two (and only two) of the factors we control for, industry and firm size...
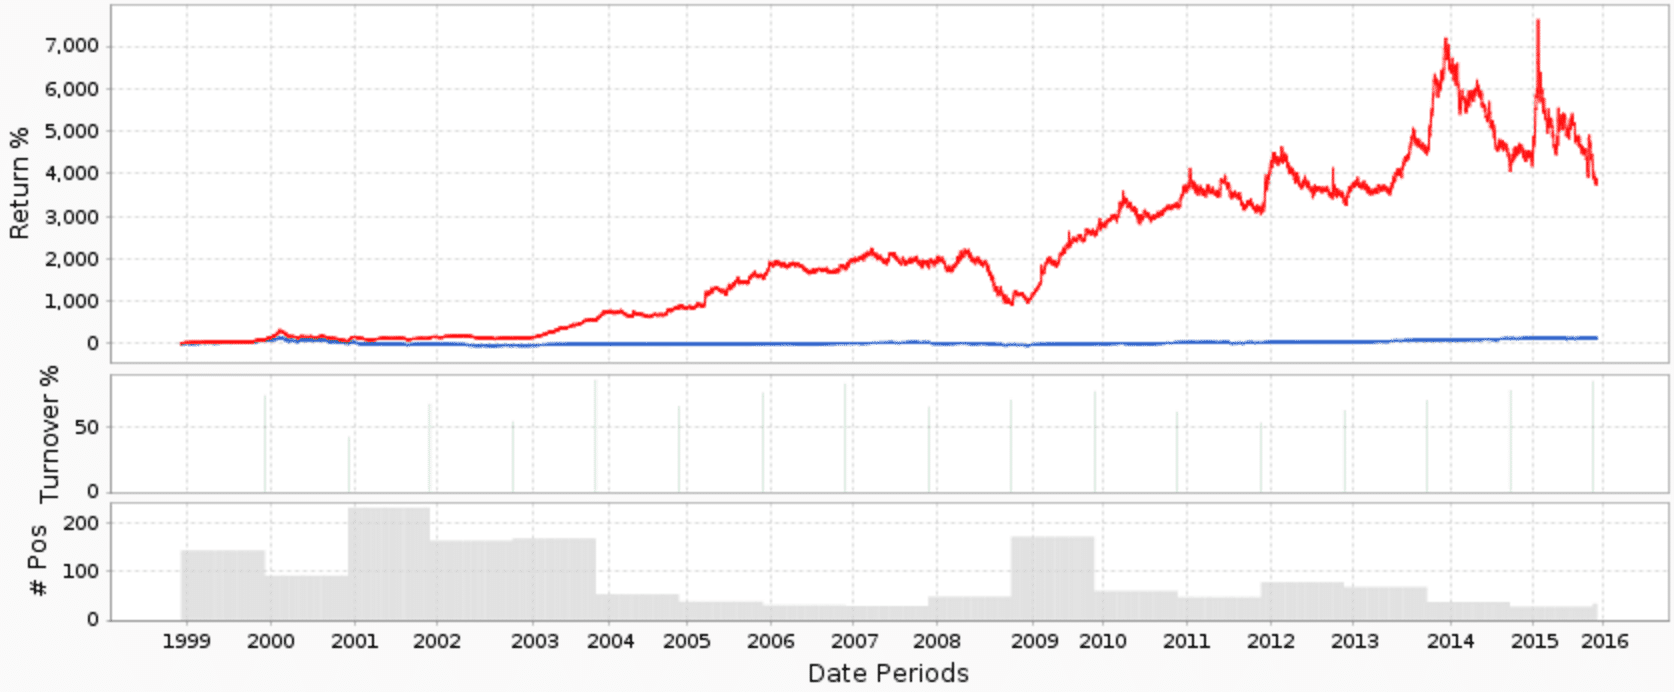
Controling for only 2 of the 10+ factors we control for would have produced a 4,000% return over the same 18 year period, versus 122% for the NASDAQ. $10,000 invested using just two of our criteria would have become $400,000! Buying a random basket of net nets over that period would have cost you $250,000 in foregone profit.... enough to buy a nice apartment.
But returns of over $1,000,000 over the same period are more than possible based on our empirically tested criteria. That's why we screen for the highest returning net net stocks.
Investing internationally is a key piece of the puzzle when seeking out the best possible net nets. Sir. John Templeton said, "If you search worldwide, you will find more bargains and better bargains than by studying one nation. Also, you gain the safety of diversification." We wholeheartedly agree. The most recent chart above shows that adding only two additional criteria really boosts returns, but it didn't eliminate the flat performance over the previous 4 years in this case. Searching for net nets internationally not only turns up much higher quality stock picks, it also helps smooth out a portfolio's performance.
How We Create Our High Performance Net Net Stock Screener (A.K.A. "Shortlist")
We start our process with a very large list of statistical net nets. These are firms that qualify as net nets based on the standardized data form Thompson Reuters. We base out initial screen on data from Thompson Reuters because the firm covers a very large number of markets worldwide and has very good depth of coverage within those markets. Thompson Reuters is also widely regarded as one of the best data providers in the world.
We call this initial NCAV stock screen our "Raw Screen," and at the time of writing it consists of roughly 600 international net net stocks, sourced from: The USA, Canada, Australia, Hong Kong, Singapore, Japan, the UK, France, Germany, Switzerland, the Netherlands, Belgium, Luxembourg, Austria, Czech Republic, Estonia, Finland, Hungary, Poland, Russia, Slovakia, Slovenia, Cyprus, Greece, Italy, Malta, Portugal, and Spain.
While Net Net Hunter's focus is on identifying the best net nets to focus your research on, drastically reducing the time it takes you to do your research, we also provide a number of metrics to help you sort through our Raw Screen. PE Ratio, Dividend Yield, Shareholder Yield, Subsector, EBITDA Yield, this will all help you identify any stocks you may be interested in that we haven't shortlisted.
This Raw Screen is our jumping off point for constructing our Shortlist. We then spend 20 hours each month combing through these firms by hand to find the highest returning net net stocks.
We start with firm size. Companies with a Market Capitalization greater than $100 Million USD are associated with lower returns as a group - so they're eliminated from contention. We also exclude firms with Market Caps smaller than $1 Million and a price per share less than $0.02 for buyability reasons.
We also eliminate firms that operate in undesirable industries. Net net stock studies purposefully exclude specific industries because those firms are not ideally suited for net net stock valuation. We also exclude resource exploration, financial, and pharmaceutical companies since these firms have been associated with terrible net net stock returns.
Debt is also out. Nothing is worse than buying a troubled company with a high debt load. A firm with a lot of debt also lacks operating flexibility and is likely to be pushed into bankruptcy if it can't pay interest on its debt. Firms with Debt to Equity ratios of less than 20% also boost returns by roughly 10%.
If you're going to base your valuation on net current asset value, it's best to include Burn Rate in your net net stock screener. Burn Rate is the rate of shrink in the firm's NCAV, and the more net current asset value is deteriorating the worse the stock's prospects. Greater deterioration means that your margin of safety is deteriorating... and thus your profit potential. We exclude firms with a Burn Rate of -15% or worse.
We also exclude firms that both do not have existing operations and are not in liquidation. This point of buying net net stocks is to buy a firm that should regain its footing and turn itself around. To do this, you need an operating business to turn around.
Finally, we eliminate firms that are selling shares since firms trading below net current asset value and selling shares have dismal returns. Selling shares below net worth destroys shareholder value, just like selling your house for much less than its worth destroys your own net worth. Management who do this also signal to shareholders that they either don't care about shareholder value or that the firm is in so much trouble that management needs all the cash it can get to survive.
Why You Absolutely Need A Shortlist - Not Just A Net Net Stock Screener
"Although I am a finance professor and long-time value investor, I find Evan's picks save me scores of hours of research and screening work. I still do my own anaysis, but now I have a short list to use."
- Mark Langenbacher, Professor of Finance, Remington College
American net net stocks have been terrible investments over the past 4 years, dropping in value by -33%, while my own net current asset value portfolio has surged 80% at the time of writing. By comparison, the NASDAQ has only seen a 30% gain. It's clear that selecting the best possible net nets from trusted First World countries produces far better returns.
Could you do all of this work yourself?
Yes, definitely. But why would you?
A net net stock screener is necessary for identifying a good number of international net net stocks. But you also need to narrow that list down to a manageable number of firms. How you do so is critical. We've focused on buyability and the characteristics that are most associated with exceptional net net stock returns. We've been studying this strategy in depth since 2011.
Assuming you have access to a net net stock screener, you'd then have to run through those stocks in much the same way we do. It takes us 20 hours per month to produce our net net stocks screener (A.K.A. "Shortlist") after 3 years of practice and refining our process. Do you really want to spend 20+ hours a month trying to replicate our work?
The ultimate goal of a NCAV stock screener is to identify great net net stocks to fit into your portfolio, but our net net stocks screen is just the beginning at Net Net Hunter. We also produce 12 high quality investment analyses per year and discuss a lot of stock ideas on our forum. All of this dramatically cuts down on the amount of work needed to run a net net stock strategy.
It took me years to realize just how good Graham's original net net stock strategy was - don't make that same mistake. Join now so you can start earning 25%+ compounded annually per year. Click Here
Read next: Is Net Net Hunter Worth It?


