How to Squeeze Higher Returns Out of Your NCAV Portfolio
Think you can beat the market by timing your purchases of cheap stocks?
Think again.
While market timing is a well known sin among the value investor community, when putting together a NCAV portfolio it's always good policy to stay as fully invested as possible.
That's a big reason why I'm always looking to buy great net nets, and why I keep sending stocks out to people who requested a free net net stock checklist. It just doesn't make sense to put off buying in the hopes that the market will get cheaper. If you get your timing wrong you could end up with significantly lower returns.
The Distribution of NCAV Stock Returns
To get a better idea why market timing can be such a bad idea when investing in net net stocks, let's take a closer look at how returns are distributed:

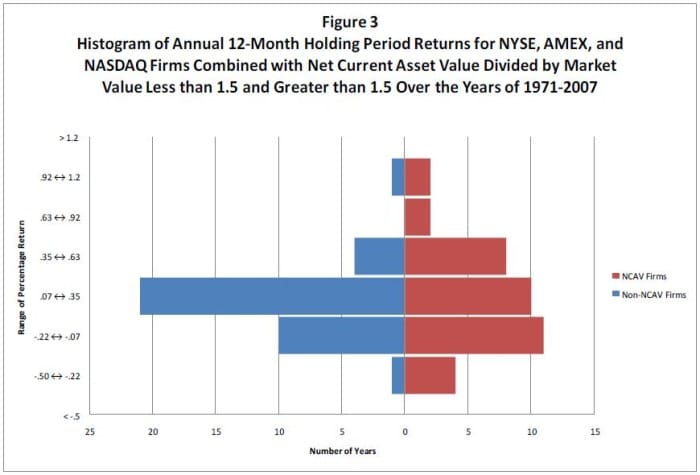
This graph was taken from the paper, "NCAV Financial Distress Risk and Overreaction".
Essentially, what you're looking at is how often NCAV firms and non-NCAV firms (that is, stocks of firms that do not meet the statistical requirements of being net nets) each achieved a specific range of yearly returns. The returns for non-NCAV firms are listed on the left in blue, while the returns of NCAV firms are listed on the right in red.
Looking at the graph from the top to bottom, we see 7 clusters of returns, from the highest yearly returns at the top to some big losses at the bottom.
One thing should immediately jump out at you. There is a long blue bar stretching out to the left about half way down the chart. The corresponding red bar representing the same range of returns for NCAV stocks is quite a bit shorter. What exactly is going on?
That long blue bar signifies the number of years that non-NCAV stocks achieve an annual return between 7% and 35%. For the 36 year period, the returns of non-NCAV stocks were clustered together much more tightly towards the 7 to 35% range than was the case for net net stocks. While non-NCAV stocks had 21 years of returns between 7% and 35%, NCAV stocks had less than half of that -- only ten!
What this implies is that NCAV stocks, as a group, have a much more varied range of yearly returns. Looking at the graph a second time, it's clear that NCAV stocks achieve a greater number of supernaturally high returning years and stumble into a greater number of money-losing years. Returns are much more volatile than those of non-NCAV firms.
NCAV Stocks and Abnormal Returns
Take a look at the bottom two rungs of the graph.
While NCAV stocks have a greater number of money losing years than non-NCAV firms, the difference isn't really that meaningful. While there were 11 years in which non-NCAV firms suffered returns of less than 7%, NCAV stocks returned less than 7% in 15 years over the same 36 year period.
What should really make your wallet sing, though, is what is shown at the top of the graph. NCAV firms had 12 years of returns between 35% and 120%... while non-NCAV stocks had only 5! This is a difference of 7 large money making years and what accounts for much of the outstanding investment returns of NCAV stocks.
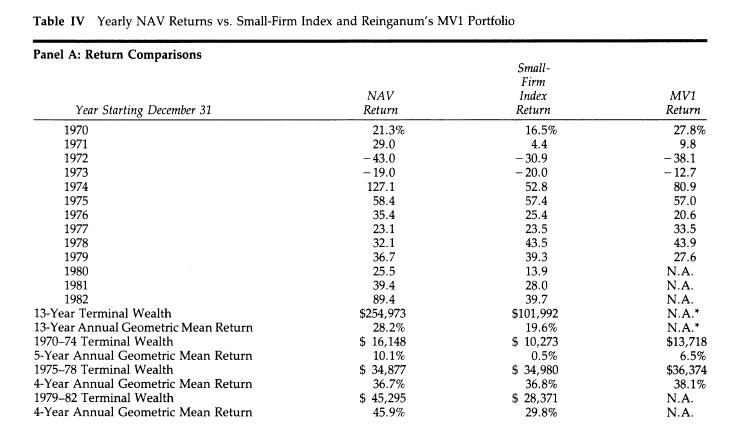
Here's a table from Henry Oppenheimer's famous study, "Ben Graham's Net Current Asset Values: A Performance Update":

Take a look at the "13-Year Annual Geometric Mean Return" for NCAV stocks identified by Oppenheimer. Over the 13 years that he studied, NCAV stocks returned a compound 28% per year. That's pretty outstanding considering he didn't screen out the less promising firms. Investors could have achieved this rate of return by maintaining a fully invested, well diversified, portfolio year after year.
A major source of that CAGR figure comes from just two fantastic years that NCAV stocks had during the period. Suppose you wanted to time the market to maximize your returns. Suppose you guessed incorrectly and ended up out of the market completely during those two best years. What would the impact on your portfolio be?
The two years in question were 1974 (with a 127.1% return) and 1982 (with an 89.4% return). Missing those two years, your compound annual return over this new 11 year period would then be 17.74% -- substantially lower than the fantastic 28.2% compound annual returns you would have achieved by just being fully invested.
For simplicity's sake, I assumed that those two years just didn't exist. Your results would be far lower if we credited you with a 0% return and stretched out the period back to 13 years. Assuming a 13 year period would drop your CAGR down to 14.8%. That's nearly half of the return achieved by NCAV stocks as a whole!
See what I mean? Any errors in timing the market could cost you big. If you missed these two years then your eventual net gain would be substantially smaller. You would have been much better off just being fully invested over the entire 13 year stretch. The same principle applies to keeping a chunk of your portfolio in cash during those years.
...or any other year for that matter. By keeping a chunk of your portfolio in cash you're in effect dragging an anchor behind your portfolio that you'll have to make up with some pretty phenomenal picks. Think about it this way: if NCAV stocks return 25% one year as a group but you're 20% in cash then your well diversified NCAV portfolio would only return 20% that year. After enough of those years, you'll start to wonder why your portfolio has seemed to have under-performed its potential.
Cashing Out to Protect Your Downside
Right now you're probably thinking to yourself that while you might miss the largest up years, you could still protect your downside by hoarding cash when the market gets expensive. Since you would be in cash, any market drop wouldn't affect your portfolio but would provide you with great buying opportunities.
This is definitely true -- if you could get the timing right -- but would likely be very difficult in practice. For one, the market can stay expensive for quite a while. If you pop out of the market in year 6, you may miss the good returns you would have otherwise netted during years 7, 8, and 9.
Another factor to remember is that net net stocks get awfully scarce the longer bull markets advance. As long as you maintain adequate diversification, proper position sizing, and your own rigorous buying standards, you'll naturally end up with a chunk of your portfolio in cash, out of the market when the market gets frothy, anyways. This acts as a natural hedge against severe bear markets while still allowing you to participate in the continued rally.
Since you're a global net net stock investor you have a lot of opportunities to choose from so the markets will really have to be overheated before you find yourself sitting in cash.
Play It Smart -- Stay Fully Stocked
Stay as fully invested as you can. It's a lesson that I had to learn the hard way over the last three years after watching my picks rocket up 38% per year and my portfolio lag behind them by ~6%.
Today, I'm trying my best to maintain my strict buying criteria, and to carve up my portfolio into 8 or 10 equally sized positions. Doing so should help me make the most out of Benjamin Graham's most profitable investment strategy. If you have the stomach for the same level of volatility that I do, then you might find it well worth your time to follow my lead.
Want to earn 20-35% annual returns over the long run? Click here to get more info.
Not ready for full membership? Make sure to request your free net net stock essential guide by entering your email address in the box below.


